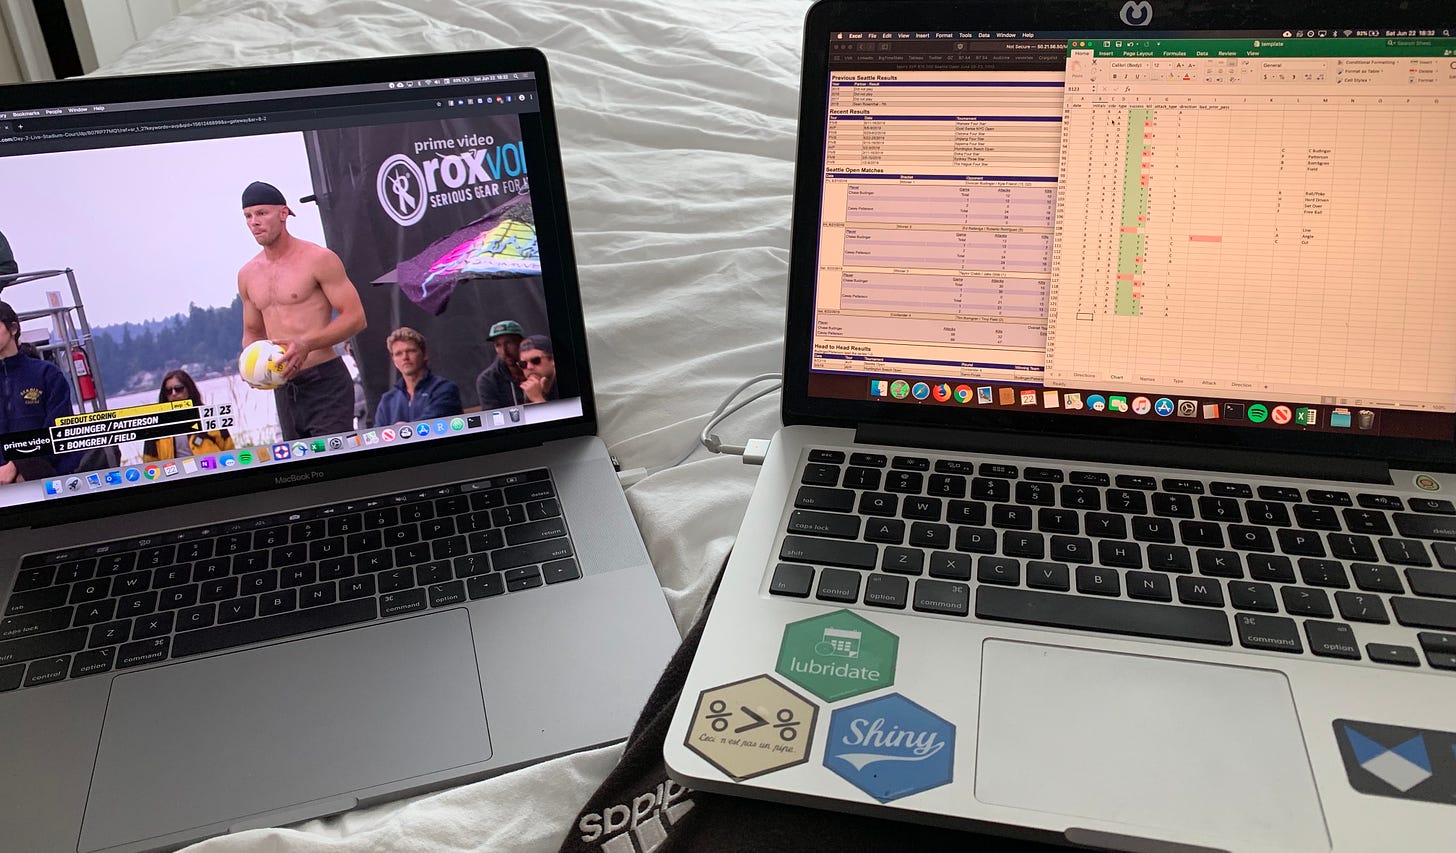
With the AVP Seattle Open underway, I thought it might be a fun exercise to chart a professional beach volleyball match. The process of collecting the data is manual but I wanted recreate the AVP match stats that are published online to test their validity. In addition, I track shot type and direction, which adds a whole new dimension to analyzing player tendencies. I watched yesterday's quarterfinal match-up of Chase Budinger/Casey Patterson vs. Tim Bomgren/Troy Field. Here was my setup during charting:

Charting
I only looked at attacks, aces, service errors, digs, and blocks, just like the AVP match stats. There were some minor discrepancies in the numbers, most likely due to certain subjective interpretations of how an action might be defined. Blocks had the biggest difference, so I also included the subset of blocks that resulted in a kill, which brought it more in line. Overall, this gives me confidence that the numbers are generally pretty representative of what transpired during the match. AVP match stats:

My stats:

If you're interested in seeing how the charting works, check out this raw excel file with directions.
Player Tendencies
In addition to collecting the match stats, I collected the player side (right or left), shot direction (line, angle, or cut), and shot type (hard driven or roll) for every attack. I then input this data into a Charting App I built for tracking my training group's stats and progress (click Training Group to see our data).

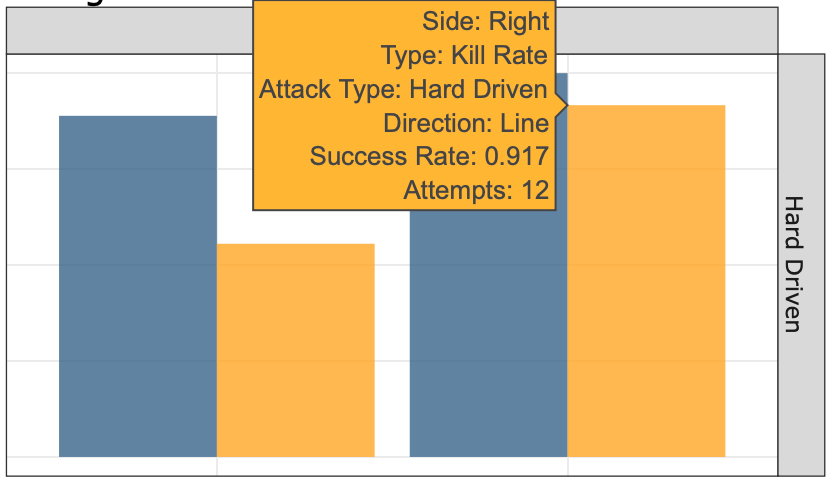
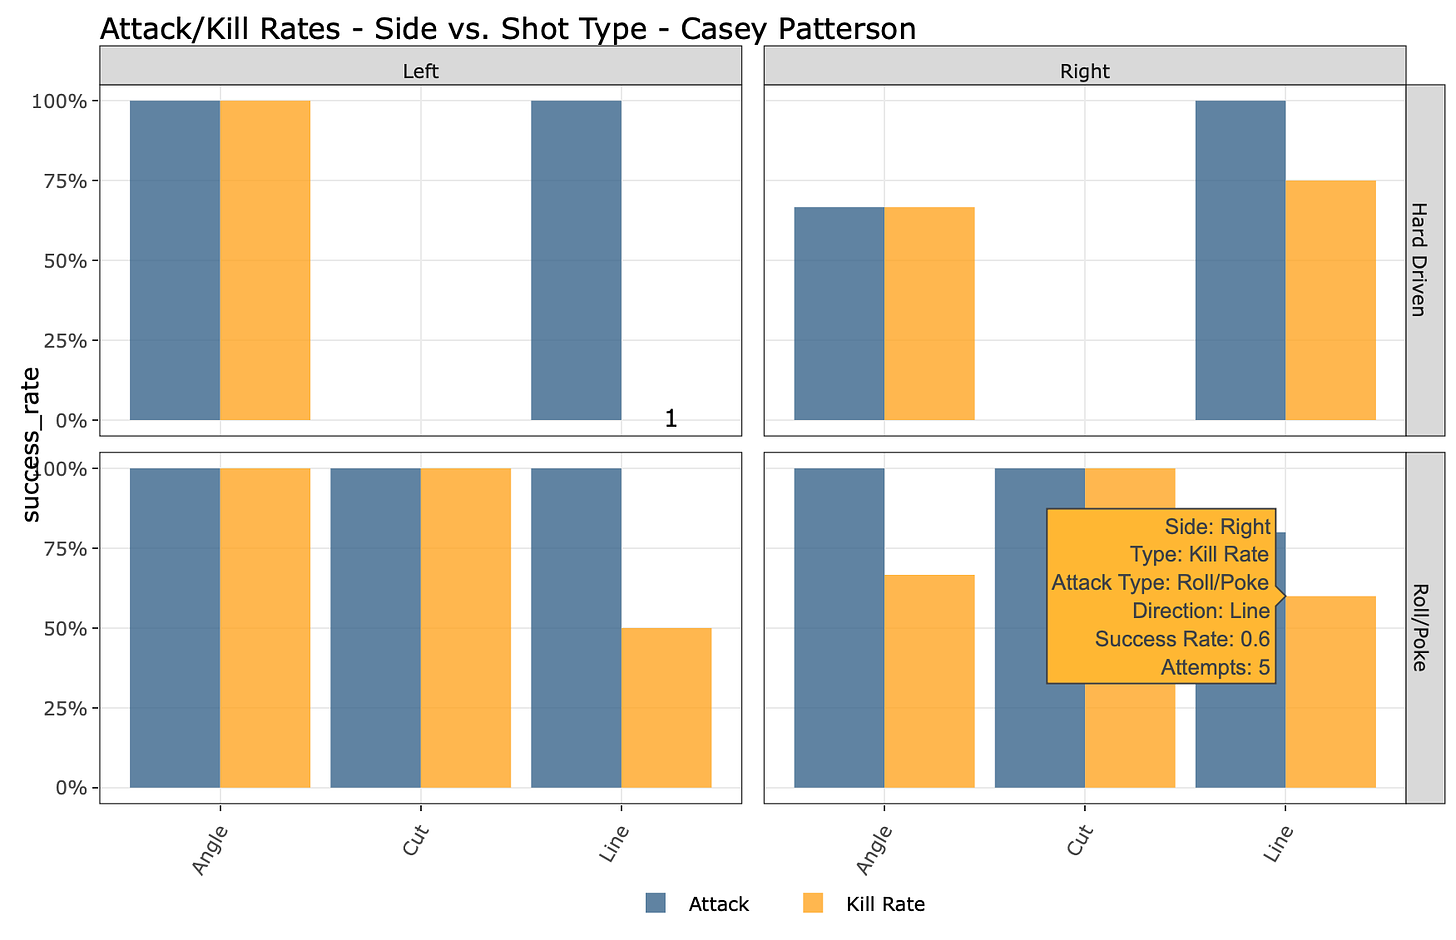
Tim Bomgren on the right side After clicking on Load Data, click on the Quadrant Stats tab to see this breakdown. On the right side, Tim Bomgren had over a 90% kill rate when hitting hard driven down the line compared to 55% for angle. When watching the match, it seemed like all attackers were really challenging the blocker. Also, it seemed like the blockers were cheating towards the middle of the court to cut off more of the angle. It might have served them better to try to defend the hard line and trust their defender to get a dig. Casey Patterson didn't have as high a success rate on high line roll shots. On the left, he was 2 for 4, while on the right, he was 3 for 5. With his higher success on hard driven shots, it might make sense to go to the roll shot less often, even if it's a slightly worse set.

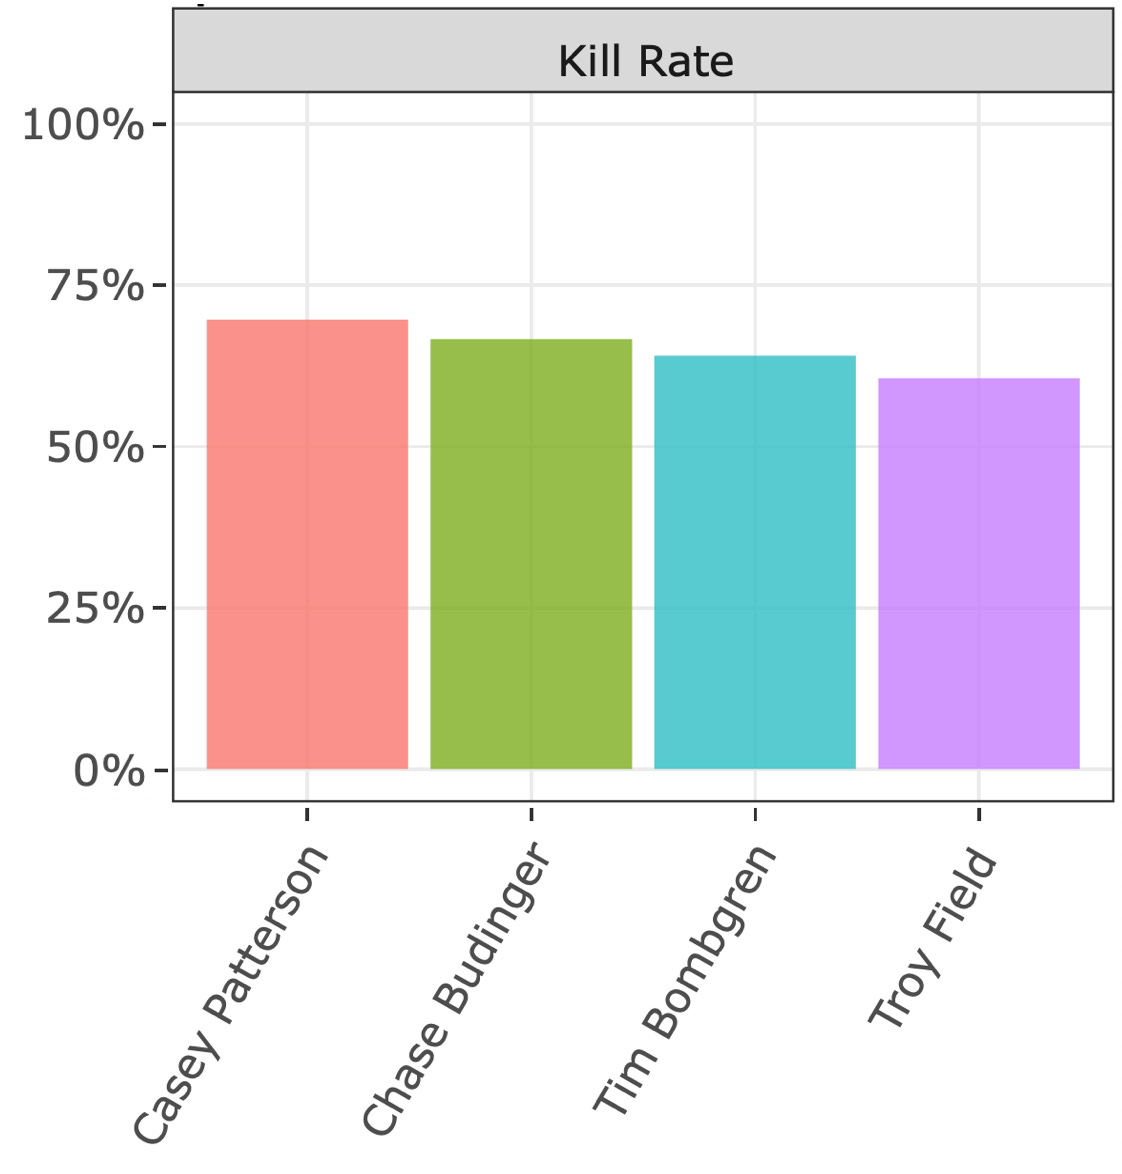
Feel free to check out some of the other player data in the tool! On the Stats by Player tab, you can see the different shot types, success rates, and kill rates. In this situation, success rate for an attack signifies the % of attacks the player successfully got into the court. Kill rate signifies the % of un-returnable attacks, i.e. winners.

Casey Patterson had the highest Kill Rate, putting down about 70% of his 33 attacks. This is slightly different than Hit Percentage, which is: (Kills - Errors) / Attacks The remaining stats: serve (errors), digs, and blocks are just counters.
Future Work
This level of granularity is helpful to break down different shot types and tendencies. However, it is also a tedious process that usually takes about 1.5 times the length of the match to chart. With that said, here is a preview of my ongoing work around trying to automate this process through machine learning. The below video is mapping body keypoints via a pre-trained deep learning model called OpenPose. In the future, it may be possible to extract these keypoints to create the same stats above along with new use cases like technique analysis. https://youtu.be/kinxcPOgn84 Stay tuned for more!


